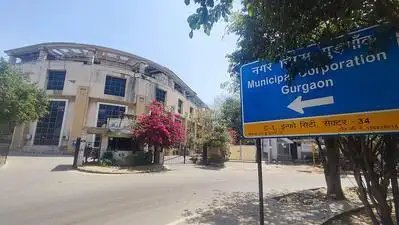










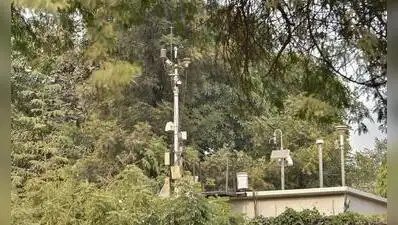
Gurgaon: Is the daily air quality index (AQI) data you see an accurate reflection of your exposure to pollution? Not necessarily. How close is that AQI monitor to where you actually live? For 92% of Haryana’s population, the answer is: not within 2km.While Central Pollution Control Board’s (CPCB) ambient air quality monitoring guidelines specifically emphasise representativeness when selecting monitoring locations, facts tell a different story — just 8.3% of Haryana’s population lives within 2km of a CAAQMS (Continuous Ambient Air Quality Monitoring Station) station.Even when the radius is stretched to 10km, only 40% of the population falls within this monitoring catchment, according to a satellite and population modelling analysis by Centre for Research on Energy and Clean Air (CREA).The numbers thus point to a fundamental problem with the state’s air monitoring network — for most of Haryana, the nearest official reading may come from a monitor many kilometres away, in surroundings that can look very different from the densely populated areas where people live, work and commute.CREA analyst Manoj Kumar told TOI, “More granular monitoring is needed to understand what people are actually exposed to.”The analysis layered WorldPop 2026 population data with the coordinates of the state’s 31 CAAQMS stations, operated by Haryana State Pollution Control Board (HSPCB) and Indian Institute of Tropical Meteorology.What the data does show is a broader issue: The state’s monitoring network is uneven both in terms of how close stations are to people and the environments in which they are located.In the city, the answer can therefore depend on where you live. A resident near Sector 51 or Vikas Sadan is likely to be much closer to a densely populated monitoring environment than someone whose nearest station is Gwal Pahari or TERI Gram.“A monitoring station can provide useful data only if it adequately captures the pollution conditions of the area it is meant to represent. If large populations are located far from monitors, or if stations are concentrated in environments that differ substantially from densely populated areas, the network may not capture the full spatial variation in pollution,” CREA analyst Manoj Kumar said, adding, “This is particularly important in cities like Gurgaon, where pollution can vary significantly between dense traffic corridors, residential areas and the greener Aravali fringe. More granular monitoring is needed to understand what people are actually exposed to.”The problem is not just distance. The analysis found that the monitoring gap is compounded by where some stations are located.When population data was combined with ESA WorldCover land-use data and Sentinel-2 satellite imagery, a strong relationship emerged between the character of the area around a monitor and the number of people it immediately serves.The share of built-up land around a station and the population within 2km showed a strong positive correlation of 0.80. Vegetation and built-up land, meanwhile, moved in the opposite direction, with a correlation of -0.74.In simple terms, the stations surrounded by dense development tend to have far more people living around them, while the greener and less built-up monitoring locations tend to have smaller populations nearby.That distinction matters because a monitor located on a green campus or forest fringe can legitimately record cleaner air than one surrounded by traffic, construction and dense habitation a few kilometres away.The difference is particularly visible in the city, which has four monitoring stations and therefore allows a comparison within the same city.At NISE Gwal Pahari, an IITM-run station on the Aravali fringe, only about 14% of the land within 500 metres is built-up. The station has just 23,719 people within its 2km catchment and among the highest vegetation levels in the dataset.TERI Gram shows a similar profile, with 16.3% built-up land around the station and about 40,964 people within 2km.The picture is markedly different at the city’s other two stations. At Sector 51 and Vikas Sadan, more than 77% of the land within 500 metres is built-up, and each station has more than 1.34 lakh people within 2km.So while all four stations carry the city’s name, they are sampling very different environments: two are in densely populated urban areas, while the other two are in substantially greener and less densely populated surroundings.This does not by itself establish that either set of stations is incorrectly located. But it does raise a question about how representative a citywide AQI can be when stations within the same city are exposed to such different local conditions.The problem is even more basic in districts with only one monitor.Nuh’s lone station, at General Hospital, Mandikhera, has just 5,310 people within 2km, the smallest immediate population catchment among Haryana’s stations.Rohtak’s only station, at MD University, has just 5,442 people within 2km. At MD University, only 0.1% of the land within 500 metres is built-up, effectively placing the monitor in a highly green campus environment.That means a single monitor located in a relatively quiet part of a district is being relied upon to provide an official reading for a much larger population living in very different surroundings.Faridabad’s four city monitoring stations are located in substantially more built-up areas, with 70% to 93% built-up land within 500 metres, and each has more than a lakh people within its 2km catchment.That gives Faridabad’s monitoring network a stronger population-level basis for representing the air experienced by residents than stations located in sparsely populated green areas.According to CPCB’s ambient air quality monitoring guidelines, more stations should be located in areas with high population density, greater industrial activity and high vehicular density. They also call for population, demographic and land-use information to be considered while identifying locations where exposure and health impacts are likely to be greatest.Technical siting requirements also seek to prevent trees and buildings from interfering with sampling. The analysis, however, cannot establish whether any individual station violates these physical requirements. That would require inspection of the actual sites.For residents of districts with a single monitor, the nearest official reading may be many kilometres away from their homes.And even where a monitor is relatively close, its surroundings matter. A station on a green campus or forest edge may record cleaner conditions than a densely built neighbourhood, busy road or industrial pocket a few kilometres away.