












A common refrain in India is that birth is a lottery, where a child is born can, in many ways, determine how their childhood is shaped, if not their entire life. But even children born in neighbouring districts may have very different courses in life. This interesting facet has emerged from an analysis of district-wise malnutrition data published in the National Family Health Survey (NFHS-6).In Nagpur district, roughly one in five children under five is classified as stunted, or too short for their age under standard child-growth measures. In neighbouring Chandrapur, also in Maharashtra’s Vidarbha region, it is more than two in five. The latest survey puts childhood stunting at 20.2% in Nagpur and 42.4% in Chandrapur. The two neighbouring districts show remarkably divergent statistics.The previous survey makes the gap harder to explain. In NFHS-5, conducted in 2019–21, Nagpur’s figure was 27.6% and Chandrapur’s 37.3%. Since then, Nagpur’s estimate has fallen and Chandrapur’s has risen.Read our interactive deep dive on child malnutrition dataIn November 2025, TOI reported on a programme for 915 mothers and children through 27 Anganwadi centres in Chandrapur’s Jiwati taluka. The people running it described low literacy, reliance on subsistence farming and little variety in children’s food. It is a reflection on how authorities are trying to reverse the worrying trend.The World Health Organization links stunting to poorer learning and school performance, more frequent illness and lower wages in adulthood. The first 1,000 days, from conception to a child’s second birthday, are particularly critical. Growth lost during this period can have lasting consequences. While some catch-up growth is possible, full recovery is often difficult.
Good news nationally, with a catch
India has made a substantial gain against stunting, which reflects the effects of poor nutrition, repeated illness and other disadvantages over a child’s early years. The national estimate fell from 35.5% in NFHS-5 to 29.3% in NFHS-6.Children’s weight-related indicators have barely changed, though. Wasting — being too thin for one’s height — went from 19.3% to 19%. Underweight prevalence, which reflects both long-term and more recent nutritional problems, remained nearly flat, going from 32.1% to 31.8%. Severe wasting did fall, from 7.7% to 5.2%. Put simply, fewer of India’s children are now classified as too short for their age, but almost one in five is still too thin for their height.
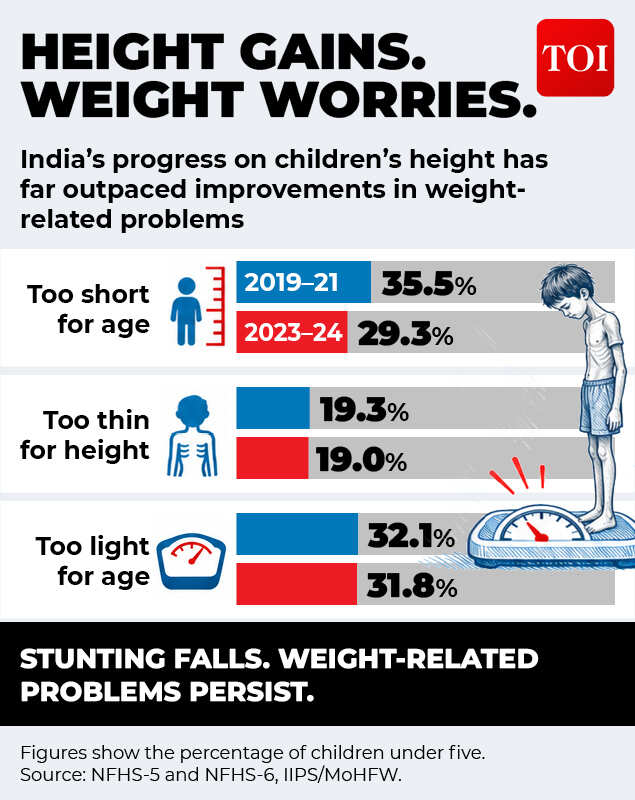
India’s fight against child malnutrition is showing progress, but not on every front. While fewer children are falling behind in height, weight-related problems remain stubbornly persistent.
TOI compared published figures for 680 districts and single-district Union territories with usable estimates for all three principal measures in both rounds. In 235, all three percentages were lower in the newer survey. In 196, stunting was lower but wasting and underweight were both higher.Vidarbha is not an exception. In Madhya Pradesh’s Malwa belt, Indore reports 22.8% stunting, against 38.6% in neighbouring Dhar. The share of underweight children is 30.8% in Indore and 53.2% in Dhar, where more than half of young children are underweight.In Maharashtra’s Marathwada, Beed’s stunting estimate is 24.8%, while Hingoli’s is 43.1%. In Odisha’s KBK region, the historically disadvantaged belt associated with Kalahandi, Balangir and Koraput, Kalahandi reports 26.9% and Rayagada 47.2%. The two districts share a boundary.
Does living near a big city help?
Often, it appears to. Nationally, stunting is estimated at 23.9% among urban children, compared with 30.9% among rural children. Look at Nagpur or Indore, and the obvious explanation might be jobs, hospitals and markets. Lucknow, too, reports a lower figure than neighbouring Sitapur: 31% against 45.5%.Tamil Nadu, though, bucks the trend. Coimbatore has a major industrial city, yet its district stunting estimate is 28%, compared with 15.6% in neighbouring Tiruppur, itself an industrial centre. The same is true in Bihar. Patna district, which contains the state capital, records 42.7% stunting, more than neighbouring Vaishali’s 36.1%. On the underweight measure, the pattern reverses: Patna’s estimate is 29.8% against Vaishali’s 36.4%. A district with a large city also includes the villages beyond it, and its average mixes both.
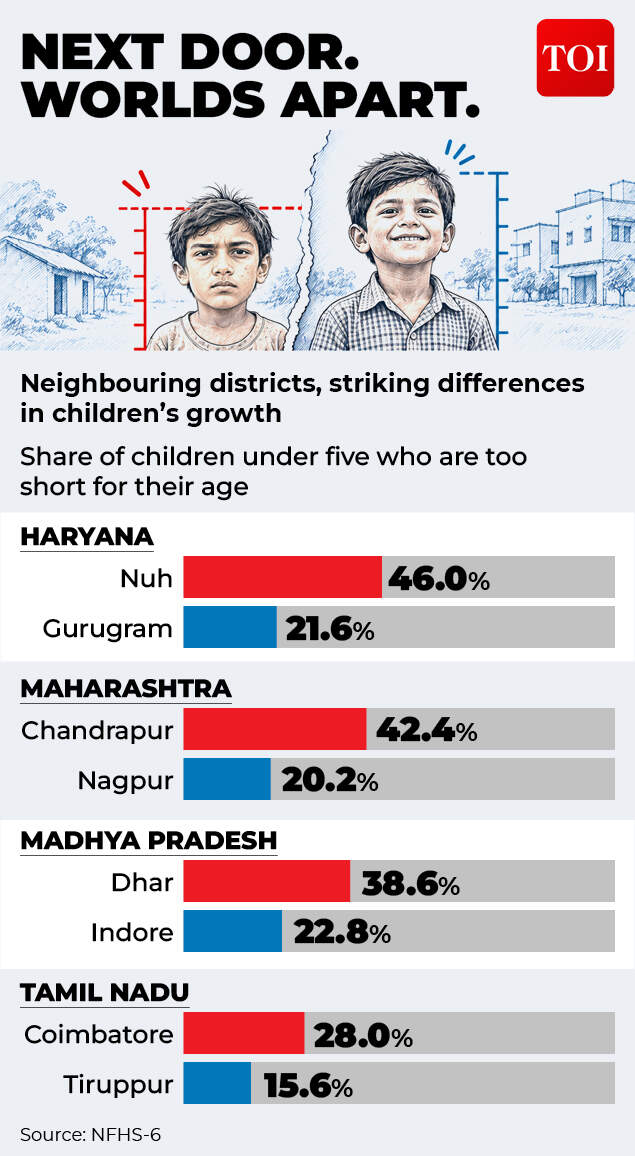
India’s latest child nutrition data reveals striking inequalities even between neighbouring districts
Research backs up the complexity of this relationship. A study of more than 443,000 children using earlier NFHS rounds found strong associations between stunting and household resources and mothers’ education. After accounting for other characteristics, urban residence on its own was not a consistent predictor in the later rounds. A family’s circumstances counted for more than its address.
The districts that were carved out
The clearest example is in Gujarat, where an official report acknowledged that averages were hiding disadvantage.Until September 2007, Tapi was part of Surat. The old district combined Surat’s large urban economy with remote tribal areas. A Gujarat government human-development report, published in 2015, said combining them in one statistical profile had obscured conditions in places needing more development attention. Tapi was created from five predominantly tribal rural talukas. At the 2011 Census, Scheduled Tribes made up about 84% of its population.In NFHS-6, the stunting difference is relatively small: 30.4% in Surat and 33.9% in Tapi. The gap shows up in weight. Wasting stands at 14.1% in Surat versus 26.9% in Tapi, where more than one child in four is too thin for their height. Underweight prevalence is 32.2% versus 43.9%.The same pattern appears where other districts were divided. Chhota Udaipur, carved out of Vadodara in 2013, reports 51.5% stunting, affecting more than half its young children, compared with Vadodara’s 35.5%. Palghar, separated from Thane in 2014, reports 42%, against Thane’s 29%. State government figures based on the 2011 Census put the Scheduled Tribe share at 37.39% in Palghar and 5.27% in the reorganised Thane district. Palghar itself spans the urbanising Vasai–Virar belt and remote settlements, so its average hides further differences within the district.In Haryana, Nuh was formed in 2005 from five blocks of the former Gurgaon district. The region had been receiving special development attention well before that: Haryana established the Mewat Development Board in 1980. Today, the stunting estimates for Nuh and neighbouring Gurugram are 46% and 21.6%. The survey’s separate measure of adequate diets among children aged six to 23 months also shows a wide gap, at 8.1% and 19.6%.Mizoram has a similar case. Mamit was carved out of Aizawl district in 1998. The latest stunting figures are 41.2% in Mamit and 23.1% in Aizawl. The Mamit administration’s 2011 Census profile identifies it as one of the state’s least urbanised districts.
What lies behind the gap
NFHS-6 found that just 15.3% of children aged six to 23 months nationally met its standard for an adequate diet, based on a combination of food groups and feeding frequency. That is up from 11% in the previous survey. It still means more than eight in ten children at that age miss out on enough variety in their food, enough meals in a day, or both.
Share your thoughts in the comments
Be respectful · TOI community guidelines
Family circumstances show up clearly in the data. An analysis of NFHS-5 found stunting among about 46% of children whose mothers had no formal education, compared with 23% among children whose mothers had higher education — half the rate. Education overlaps with household wealth, maternal health and living conditions, so this is an association, and the separate effects are hard to untangle.There are limits to these comparisons. NFHS is not a census of every child, and its rounds do not follow the same children. District estimates have sampling uncertainty, which this analysis has not independently quantified. Research using earlier surveys has also found that the season of measurement affects wasting. Yet, as India looks to become more prosperous, the onus is on ensuring that none of the next generation falls through the cracks. That would be a big step towards becoming a developed nation.