








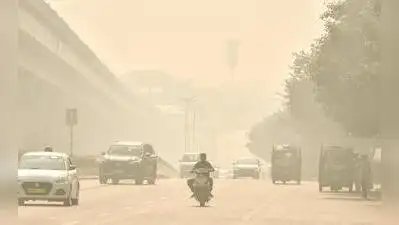
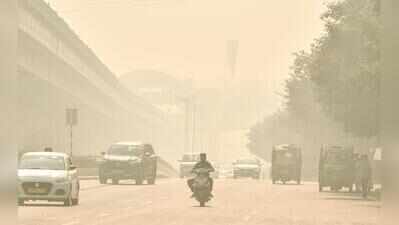
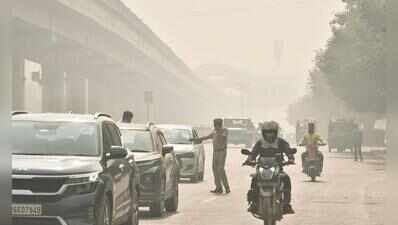
Gurgaon: The city’s AQI was recorded at 258 on Wednesday, down from 290 the day before, but remained in the poor category, with Vikas Sadan being the only one of the four stations clocking a very poor AQI at 328. The 4 pm update showed that NISE Gwalpahari recorded an AQI of 216, Sector 51 259, and TERI Gram 228. The Delhi-NCR early warning system forecast a mixing depth of 1,400 metres on Wednesday, falling to 1,100 metres on Thursday, with ventilation conditions expected to remain unfavourable for pollutant dispersion. Winds were forecast to shift from northwesterly to northerly on Wednesday and from northerly to northwesterly and easterly on Thursday, with speeds of up to 10 kmph. The system has forecast very poor air quality for Thursday and Friday.A two-day comparison of CPCB-CCR daily average PM2.5 data across 28 NCR cities showed that concentrations declined in 19 cities between Nov 16 and Nov 17, but the improvement was uneven. The city recorded a 22% decline, from 164.4 to 128 micrograms per cubic metre, while Faridabad saw a 34% increase, from 104.5 to 140. Ballabgarh continued to record a high daily average of 165.45 micrograms per cubic metre. Panipat recorded a more than twofold increase to 196.8, while Karnal saw a 107% rise to 141.8.Dr Manoj Kumar, who analysed the data, said the improvement was geographically widespread but not uniform. “It’s not just Delhi. PM2.5 concentrations declined across 19 of the 28 NCR cities, with data from both 16 and 17 November, indicating a geographically widespread improvement,” he said. He pointed to a 42% decline in Delhi and reductions in Charkhi Dadri (47%), Baghpat (37%), Bahadurgarh (29%), Noida (31%) and Gurgaon (22%). However, concentrations rose sharply in Karnal (107%), Panipat (101%), Muzaffarnagar (63%) and Faridabad (34%).The IITM-Delhi Decision Support System assessment attributed the improvement on Nov 17 partly to favourable meteorological conditions, including northwesterly winds of up to 15 kmph, a mixing depth of around 1,500 metres and a ventilation index of 6,200 square metres per second, which would have aided pollutant dispersion.According to guidelines issued by the Central Pollution Control Board (CPCB), when AQI is in the ‘moderate’ category, there can be breathing discomfort to people with asthma and lung or heart disease. In ‘poor’ AQI, breathing discomfort can be experienced by most people on prolonged exposure. An AQI between zero and 50 is considered ‘good’, 51 and 100 ‘satisfactory’, 101 and 200 ‘moderate’, 201 and 300 ‘poor’, 301 and 400 ‘very poor’, and 401 and 500 ‘severe’.