








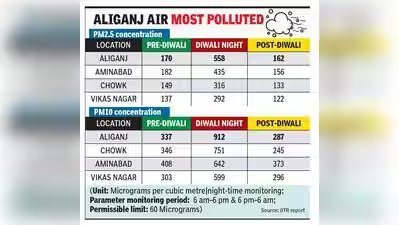
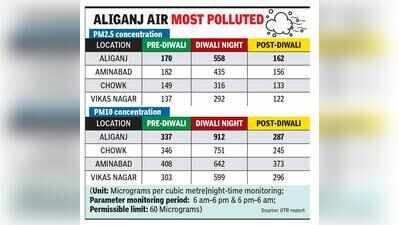
Lucknow: Did Lucknow’s overall AQI figures understate the severity of air pollution levels on Diwali night?The question has come into focus after an air pollution assessment report released by the Indian Institute of Toxicology Research (IITR) on Wednesday showed that pollution levels in parts of the city soared to dangerous levels during Diwali, despite overall citywide AQI averages appearing less severe. (See graphics)“An exact comparison of the data released by the two agencies — IITR and Central Pollution Control Board (CPCB) — is not possible because both monitored air quality at different locations and over different durations. However, a closer look does provide some indication of the contrast between the findings of the two reports,” said a senior scientist.Experts said CPCB tracks eight criteria pollutants and calculates the Air Quality Index (AQI) using 24-hour rolling averages rather than short-term pollution spikes. These pollutants include PM2.5, PM10, nitrogen dioxide (NO₂), sulphur dioxide (SO₂), carbon monoxide (CO), ozone (O₃), ammonia (NH₃) and lead (Pb). In Lucknow, PM2.5 and PM10 are the pollutants that most often drive AQI levels.Of CPCB’s six monitoring stations in the city, three are located in relatively green surroundings at Kendriya Vidyalaya, Aliganj; Kukrail Picnic Spot; and Babasaheb Bhimrao Ambedkar University near Shaheed Path. These sites generally record lower pollution levels, which experts attribute to their greener surroundings. The remaining stations at Lalbagh, Talkatora District Industries Centre and Gomti Nagar are exposed to comparatively higher pollution levels, experts said.According to CPCB data, Lucknow’s 24-hour average AQI from 4pm on Sunday (Diwali) to 4pm on Monday was 245, placing it in the ‘poor’ category. The period included Diwali night, when firecrackers were set off across the city.Under the National Air Quality Index framework, AQI values of 0-50 are categorised as ‘good’, 51-100 as ‘satisfactory’, 101-200 as ‘moderate’, 201-300 as ‘poor’, 301-400 as ‘very poor’ and 401-500 as ‘severe’.Experts said an AQI of 245 reflects city-level monitoring averages and may not fully capture higher pollution levels experienced in some densely populated localities during peak hours.In contrast, IITR monitored air quality in residential and commercial localities including Aliganj, Vikas Nagar, Aminabad and Chowk, where human activity is higher. Monitoring was conducted from 6pm on Sunday to 6am on Monday, covering the Diwali night period.The report found average PM2.5 concentrations during the 12-hour period at 558 micrograms per cubic metre in Aliganj, 435 in Aminabad, 316 in Chowk and 292 in Vikas Nagar, far above the National Ambient Air Quality Standards (NAAQS) 24-hour standard of 60 micrograms per cubic metre.Average PM10 concentrations during the same period were 912 micrograms per cubic metre in Aliganj, 751 in Chowk, 642 in Aminabad and 599 in Vikas Nagar, far above the NAAQS 24-hour standard of 100 micrograms per cubic metre.“Since CPCB uses a 24-hour average, its monitoring period included several hours when pollution levels had already begun to decline, which was reflected in the AQI value. Moreover, the location of several monitoring stations in relatively greener areas may have contributed to lower average readings. In contrast, IITR monitored air pollution in four densely populated areas over a shorter 12-hour period,” experts explained.